Dengan demikian kita dapat mengetahui posisi suatu tempat ya
ng akan kita cari sesuai Lintang Utara dan Lintang Selatan sebelah utara khatulistiwa Indonesia. Dalam istilah Bahasa Inggris Latitude (North, South) dan Longitude (East, West).
Dengan memanfaatkan situs Montana kita bisa melakukan konversi koordin
at seperti contoh dibawah ini :

dibawah ini
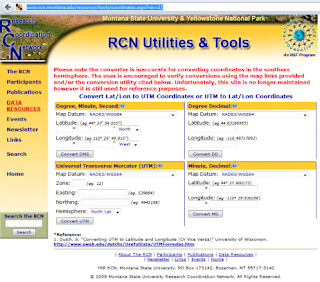
udian dilakukan konversi bisa mendapatkan informasi lebih jelas. Dari nilai koordinat tersebut dapat
4. Kita dapat menentukan koordinat yang lain seperti :
b. Latitude : -6.191115 dan Longitude : 106.835983, daerah Jl RP Soeroso Gondangdia
c. Latitude : 2.250245 dan Longitude : 98.985329, daerah Siboron
g-Borong, Sumatera
Utara
d. Latitude : 1.393066 dan Longitude : 99.270287, da
erah Padang Sidempuan, Sumatera Utara
e. Latitude : 2.391578 dan Longitude : 98.72818, daerah Danau Toba, Sumatera Utara
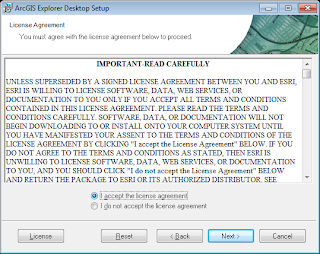
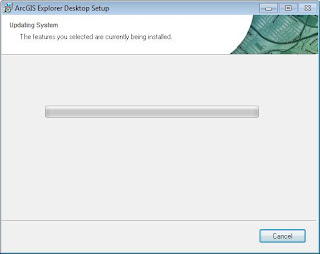
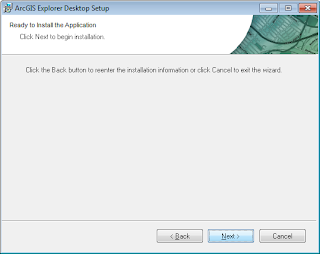
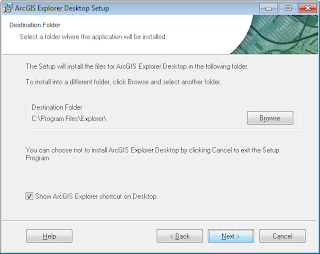
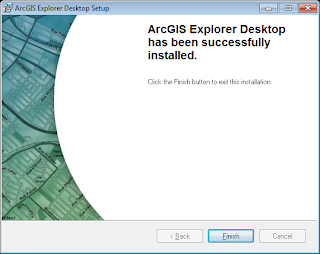
2. Install software Arcview dan Arcgis
· Software Arcview
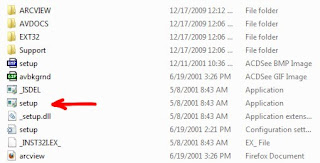
· Tentukan pada DROP-DOWN mode kompatibilitas yang diinginkan, misalnya Windows XP (S
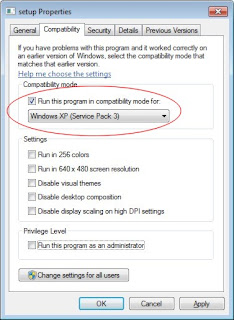
· Jika perlu, centang juga tanda RUN THIS PROGRAM AS AN ADMINISTRATOR
· Klik OK untuk keluar jendela Properti
· SELESAI
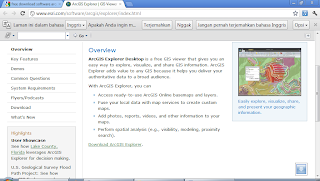
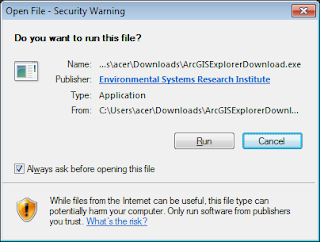
· Software Arcgis
Pertama – tama buka situs dibawah ini:
http://www.esri.com/software/arcgis/explorer/index.html
Kemudian klik Download ArcGIS Explorer

3. Review tentang software GIS
· Berbayar
1. Software ILWIS
kelebihan dari ILWIS adalah lebih baik digunakan untuk pemanfaatan analisa ketinggian,kontur, arah aliran material dan fungsi pendukung analisis hidrologi dan DAS.
kekurangannya adalah operasional penggunaan software yang lebih rumit disbanding software GIS berbayar lainnya, serta menuntut proses yang harus berurut sesuai dengan teori dan prinsip GIS / RS.
Bagi pengguna QGIS, tidak perlu khawatir, karena di QGIS ada tool yang serupa bernama f-tools. Jika anda menginstall QGIS terbaru dan atau terhubung ke internet, tool ini akan secara otomatis ada di dalam QGIS.
· Opensource
1. Desktop GIS
Desktop GIS merupakan aplikasi Sistem Informasi Geografis yang bersifat standalone, yang maksudnya hanya bisa dijalankan pada sebuah PC (Personal komputer). Sifatnya yang standalone ini membuat Desktop GIS tidak bisa diakses oleh orang lain tanpa terlebih dahulu melakukan proses instalasi aplikasinya di PC. Seperti telah dijelaskan sebelumnya bahwa aplikasi ini memiliki kelebihan dan kekurangan. Kelebihan yang ditawarkan dari Desktop GIS adalah kemampuannya dalam melakukan analisis dan pengolahan data, sedangkan kelemahannya adalah terbatasnya tingkat aksessibilitas dalam distribusi informasinya.
AccuGlobe
(additional functionality available for purchase)
Platform: Windows
Last update: 2007
• Real-time projection (both vector and raster)
• Support for ECW raster layers
• Support for JPEG 2000 layers
• Support for PNG layers
• Legend grouping – will support groups within groups
• Dynamically show and hide whole or partial themes via legend
• Edit multiple layers at the same time
• No longer restricted to editing a single feature
• Can modify attribute information in either identification window and attribute table
• Incorporates a structure editor
• Supports Undo/Redo
• Can update X,Y attribute columns for point layers
• Copy & Paste multiple attributes
• Can dynamically add/remove fields while in edit mode
• Sorting in attribute table
• Reorder attribute column names
• No longer restricted to a single attribute table
• Enhanced calculation capabilities
• Enhanced statistical evaluation
• Multiple map support
• Hotspots
• Dockable components
• Identification window shows differences between current and previously identified feature
• Attribute data types are differentiated in attribute table & identification window
• Built in script capability
• Built in vector layer checker
• Spatial index supports null geometries
• Anti-alias support
• Cropping of features to ensure that labels are visible when zoomed in
• Managed spatial and attribute indexes
• Enhanced database relates
• Spatial Relate
• Merge multiple layers into one
• Halo effect for label themes
• Integrate remote data with Web Mapping Service (WMS)
DIVA
Platform: Windows
Last update: 2006? Updates unlikely
Feature list:
• Grid manipulation (calculator, aggregate, neighborhoods)
• Point to grid/polygon/point analysis
• Projection of lat/lon data
• Analysis of molecular data
• Export/import of grid and shapefile data
• Spatial autocorrelation
• Histograms and scattergrams of gridfiles
• Visualization of satellite images
• Multiple regression with grids
• Import data from GPS (as points, lines, or polygons)
• Climate envelope modeling
• Prediction of crop adaptation (Ecocrop)
• Draw Shapefiles
• Polygons to grid transformation
• … and even more
DIVA (uDIG)
Platform: Windows,Linux
Last update: 2007
Forestry GIS (fGIS)
Platform: Windows
Last update: 2005; further updates unlikely
• Open and view geo-referenced raster images including digital orthophotos and topographic maps in MrSID®, ECW, BIL, ADF, JPG, TIFF, GeoTIFF, BMP, IMG, JPEG2000, PNG and SDTS file formats.
• Open and view vector data in ESRI® shapefile (SHP) and e00 files, AutoCAD DXF™, MapInfo® MIF, Microstation® DGN, DLG-O, TIGER2000/line, GML/XML, SDTS and TatukGIS SQL (ttkls) file formats. An advanced R-Tree index system allows easy viewing of large (100+ MB) data files.
• Create and edit point, line and area shapefile objects and their associated data attribute tables. fGIS also edits and writes MIF, DXF, DLG & GML vector layers.
• Buffer point, line or area objects at any designated radius or width.
• Generate Cruise Points. Select an area object and fill it with either a random or ordered grid.
• Design maps with pre-defined layer symbology, or use advanced layer properties to define your own.
• Copy and paste shapefile objects from one layer to another.
• Designate the direction and distance of the next leg of a line or polygon with the COGO-like Traverse Tool. Directions can be entered in decimal degrees or degrees-minutes-seconds (handy for plotting deeds or laying out a field data collection route).
• Split a polygon or line (including GPS tracks) into separate units by drawing a line with the Split Shapes Tool.
• Clip Shapefiles to the boundaries of a polygon layer.
• Merge multiple shapefiles into a new one.
• Customize map properties including line width and color, area fills, label fonts and positions, image transparency, thematic rendering of data and more.
• Measure areas and distances. fGIS reports distances and areas in English units (feet, miles and acres) and metric units. Area and perimeter measurement fields can be added to data tables and updated automatically.
• Display data at user-specified scales.
• View maps in 3D.
• Map live GPS positions from any connected GPS unit with NMEA output (beta).
• Extract geo-referenced images of selected portions of a screen display.
• Export part of a vector layer and save it as a new file.
• Manage large data sets organized in dBase tables with the “Load Library Layer” utility.
• Join dBase and Access tables to shapefile attribute tables.
• Create point shapefiles from comma delimited text files with x|y coordinates.
• Convert Geographic WGS84 coordinate shapefiles to and from worldwide UTM zones and Wisconsin Transverse Mercator.
• Print the map with three flexible output options. The Simple Print command will add a map title, subtitle, footer and the scale to the page. The Send Map to Word command will send an image of the view at a user specified resolution and scale to Microsoft® Word. A third option through the Export Image tool will send the map to a technical illustration/page layout module called Diagram Designer. You can add headers, legends, annotations and non-spatial symbols from template palettes in the Diagram Designer module.
• Save WMF files for use in publishing programs.
GRASS, JGrass
Platform: Windows (Cygwin and native), Linux, Macintosh
Last update: 2008
GRASS sebenarnya adalah program GIS Open Source yang powerful, namun Graphic User Interface-nya tidak menarik, masih menggunakan command-line; hampir seluruh proses menggunakan data grid, walaupun juga memiliki kemampuan untuk mengolah data. JGrass sendiri adalah multi-platform Java-based version dari GRASS, saat ini hanya fokus pada penggunaan untuk analisis hidrologi dan geomorfologi.
gvSIG
Platform: Windows, Linux, Macintosh
Last update: 2008
Menggunaakan JUMP Platform sebagai sourcenya. Memiliki kemampuan vector editing layaknya ArcView GIS 3.x. Saya sendiri berencana membuat modul gvSIG yang sedianya akan bisa di unduh gratis di blog ini. Doakan saya ada waktu dan tenaga ya…
HidroSIG
Platform: Windows, Linux
Last update: 2004?
A GIS for “estimation and analysis of hydrological, climatic and geomorphological variables”.
HYDROLOGY AND MAPS VISUALIZATION
• Display of maps in raster and vectorial formats.
• Tools of processing and analysis of Digital Terrain Models (DTM).
• Automatic extraction of drainage networks and river basins.
• Tools for geomorphological analysis of river networks.
• Topologic and Geometric Width Function of river networks.
• Horton Analysis of river networks.
• Generalized Horton Analysis (Simple scaling of network properties).
• Network links analysis (Length, area, slope, etc) including xy-plots for link properties (e.g. Hack’s Law).
• Rainfall- Runoff Model : Distributed Hydrological tank model that works with rainfall time series, for making estimations of discharge in any point of the basin.
• Land-stability model : Works in conjunction with the rainfall-runoff model. It computes security factors in the hillslope, after a storm event.
• Water quality model : Computes pollution transport along a river network ( One Dimensional Transport Equation) .
• Hydrological balances, estimation of maximum discharges and minimum discharges in river basins from maps of climatic variables.
• Erosion in river basins.
• Extraction of terrain and river profiles.
• HidroSIG is able to store time series of any variable in a MySQL database.(e.g. Climatic stations)
• For the study of the statistical properties time series, HidroSIG has a module called ANSET that makes Homogeneity tests for time series. It also detects outliers by different methods..
• Search for information of hydro climatic stations using SQL queries .Display of information of hydro climatic stations.
• Map´s histograms.
• Modification of raster maps.
• Tools for creation of vectorial files.
• Conversion from vectorial maps to raster maps.
• Three-dimensional display of maps.
• Map´s calculator.
• Interpolation of raster maps.
IMPORT AND EXPORT
• Import of raster maps from formats:
- Arcview ASCII
- Nasa SRTM
- Idrisi (r)
- Surfer GRID (Ascii)
• Import of vectorial maps in AutoCAD DXF format .
• Import of vectorial maps ESRI Shapefile format.
• Export of raster maps in format ArcView ASCII.
REMOTE SENSING AND IMAGE PROCESSING
• Module of remote sensors for classification of Landsat and spot images.
OTHERS
• Architecture Client/server of the Information.
• Connection to a remote database.
• Customized Colors palette.
• Multilanguage (Spanish/English).
• 100% made in JAVA.
Teigha Viewer adalah free software untuk menampilkan CAD file sekaligus sebagai converterke versi CAD lainnya yang bisa digunakan pada sistem operasi Linux, Mac dan Windows.
Teigha Viewer cocok untuk Anda yang bekerja dengan CAD file hanya untuk melihat data tanpa melakukan editing yang kompleks. Atau untuk Anda yang ingin membuka CAD file untuk di konversikan ke format dan versi yang lain.
Dengan Teigha Viewer Anda bisa membuka CAD file dengan format DGN, DWG serta DXF. Fitur konversinya, memungkinkan pengguna untuk menyimpan dengan beragam format tersebut mulai dari versi R9 dan R12 sampai 2010.T
Tidak ada komentar:
Posting Komentar